As AI initiatives scale across organizations, directors face increasing pressure to demonstrate ROI while managing complex cost structures. Unlike traditional IT investments, AI projects present unique financial challenges—from unpredictable compute costs to hidden operational expenses that can quickly spiral out of control.
The reality is sobering: according to recent industry data, over 60% of AI projects fail to deliver expected value, often due to poor cost management and unclear success metrics. Directors who lack visibility into their AI spending risk budget overruns, failed initiatives, and difficult conversations with stakeholders.
This guide cuts through the complexity to focus on five essential cost metrics that provide real insight into AI performance and value. These aren’t theoretical frameworks—they’re practical measurements that successful organizations use to optimize their AI investments and drive meaningful results.
1. Data Acquisition and Preparation Cost Ratio
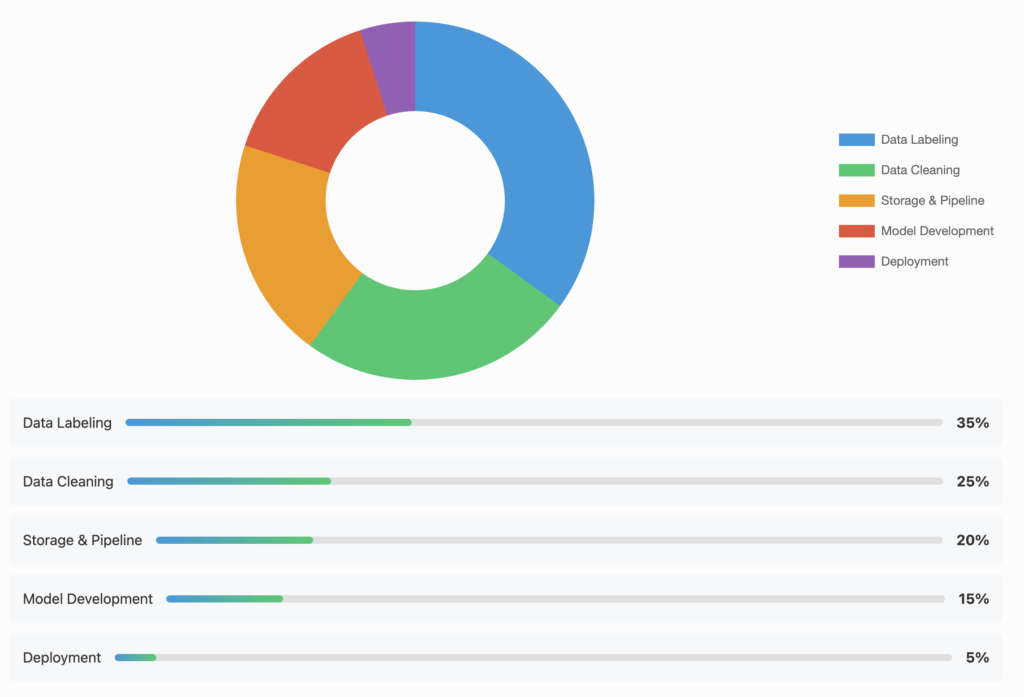
Data is the fuel for AI, but it’s often the most underestimated expense. This metric tracks the percentage of your AI budget consumed by data-related activities versus actual model development and deployment.
Key components to track:
- Data purchasing and licensing fees
- Data cleaning and labeling costs
- Storage and data pipeline infrastructure
- Privacy compliance and security measures
- Internal labor for data preparation
Why it matters: Many organizations discover that 60-80% of their AI project costs stem from data preparation, not model development. A manufacturing company found they were spending $3M annually on data labeling alone—more than their entire ML engineering budget.
Optimization strategies:
- Implement automated data quality checks
- Invest in synthetic data generation where appropriate
- Build reusable data pipelines
- Negotiate volume-based pricing with data providers
Action item: Calculate your current data cost ratio and benchmark against industry standards (typically 40-60% for mature organizations). If yours exceeds 70%, prioritize data infrastructure improvements.
2. Cost per Inference/Prediction
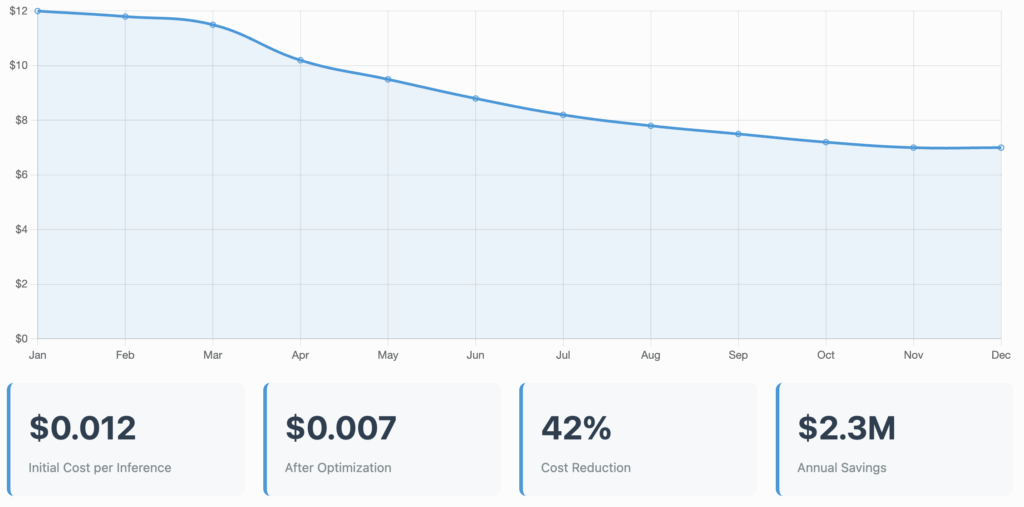
This metric reveals the true operational efficiency of your AI models in production. It’s calculated by dividing total runtime costs by the number of predictions or inferences made.
What to measure:
- Compute costs per prediction
- API call expenses (for cloud-based models)
- Data transfer and storage costs
- Response time and its impact on infrastructure needs
Real-world example: A retail company reduced their recommendation engine’s cost per inference by 40% by optimizing model architecture and implementing intelligent caching, saving $2.3M annually.
Optimization strategies:
- Model compression and quantization
- Edge deployment for high-volume use cases
- Batch processing where real-time isn’t required
- Regular performance profiling and optimization
3. AI-Driven Revenue Attribution
Understanding how AI directly impacts revenue is crucial for justifying continued investment. This metric tracks revenue that can be directly or indirectly attributed to AI implementations.
Measurement approaches:
- Direct attribution (sales from AI-powered recommendations)
- Incremental lift analysis (A/B testing AI vs. non-AI approaches)
- Customer lifetime value improvements
- Cost savings converted to revenue equivalents
Common pitfall: Many organizations struggle to isolate AI’s impact from other factors. Establish clear baselines before AI implementation and use control groups where possible.
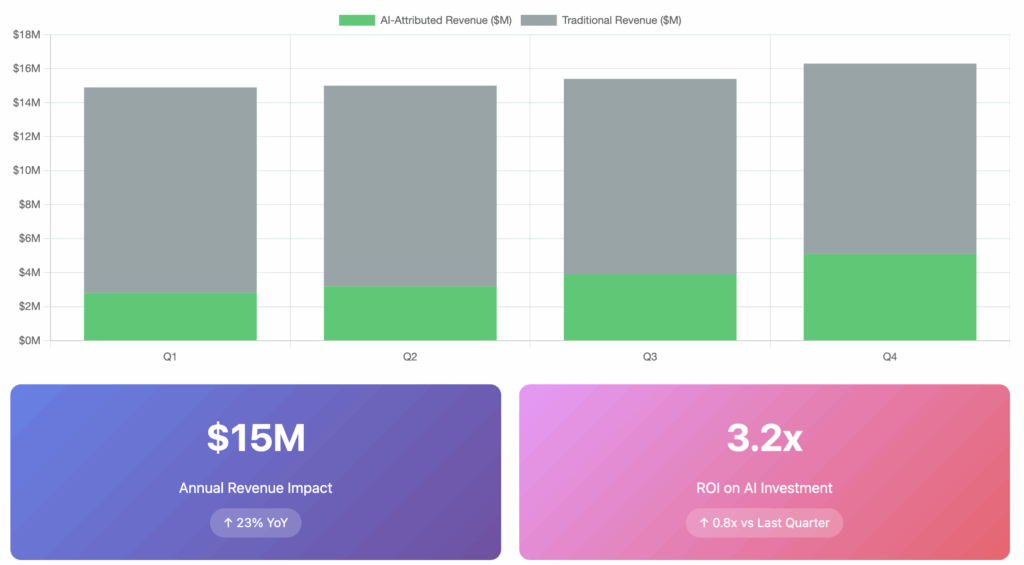
Success story: An e-commerce platform attributed $15M in additional annual revenue to their AI-powered personalization engine by carefully tracking conversion rate improvements against a control group.
4. Model Performance Degradation Cost
AI models don’t maintain consistent performance indefinitely. Model drift—when performance degrades due to changing data patterns—creates hidden costs that compound over time.
Cost impacts of degradation:
- Lost revenue from poor predictions
- Increased customer complaints and support costs
- Emergency retraining expenses
- Reputation damage and customer churn
Monitoring framework:
- Set performance thresholds and automated alerts
- Track accuracy metrics continuously
- Calculate the business impact of each percentage point drop
- Budget for regular retraining cycles
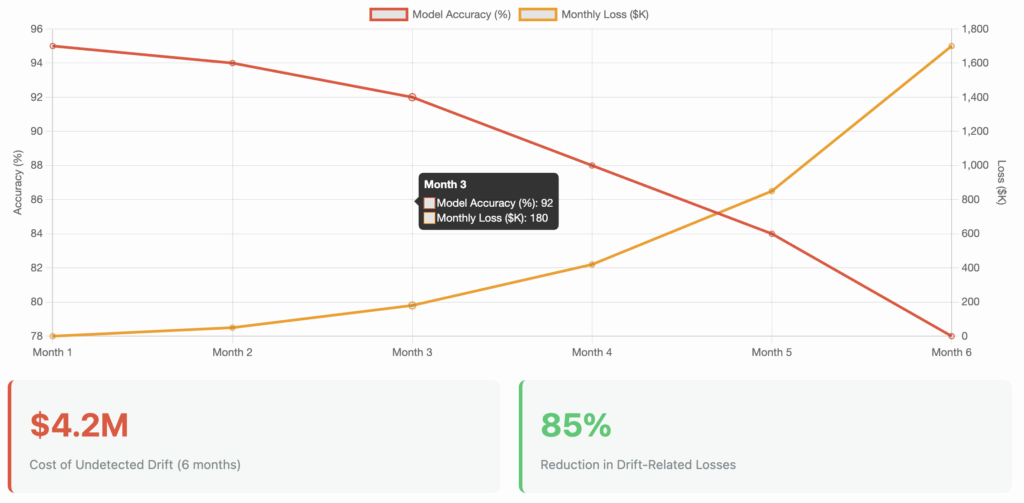
Case study: A credit scoring model’s undetected drift cost a bank $4.2M in bad loans over six months. They now monitor performance daily and retrain quarterly, reducing drift-related losses by 85%.
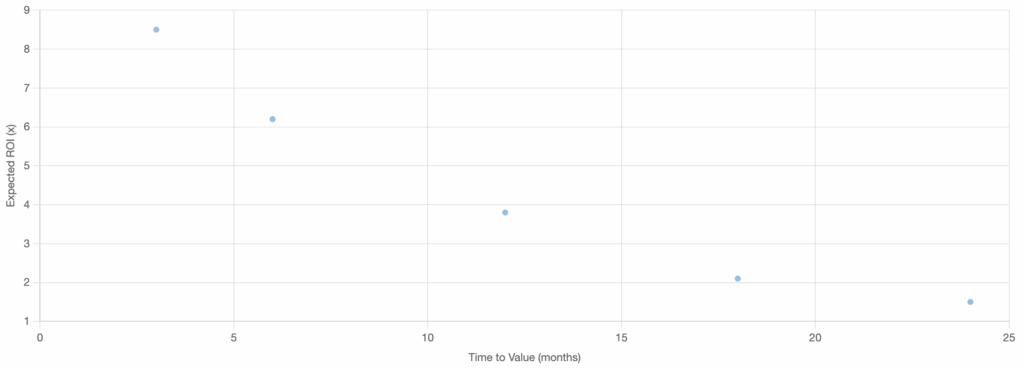
5. Opportunity Cost of AI Resource Allocation
This often-overlooked metric helps directors make strategic decisions about where to invest limited AI resources for maximum impact.
Key considerations:
- ROI comparison across different AI initiatives
- Time-to-value for competing projects
- Strategic alignment with business objectives
- Resource constraints (talent, infrastructure, budget)
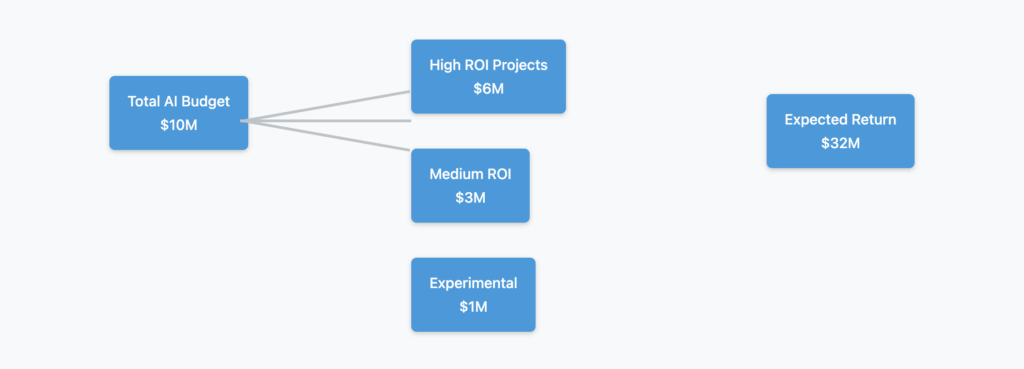
Evaluation framework:
- Rank all potential AI projects by expected ROI
- Consider implementation complexity and timeline
- Assess strategic value beyond financial returns
- Review quarterly and adjust priorities based on results
Example: A healthcare organization chose to prioritize an AI-powered appointment scheduling system over a diagnostic assistant, achieving 3x faster ROI and freeing resources for the more complex diagnostic project later.
Implementation Roadmap
Start tracking these metrics systematically:
- Month 1: Establish baseline measurements for existing AI initiatives
- Month 2: Implement automated tracking and reporting systems
- Month 3: Create dashboards for real-time visibility
- Quarterly: Review trends, optimize underperforming areas, and adjust strategies
The Bottom Line
Effective AI cost management isn’t about minimizing spend—it’s about maximizing value. These five metrics provide the visibility needed to make informed decisions, optimize investments, and demonstrate clear ROI to stakeholders.
Directors who master these metrics position their organizations to scale AI initiatives sustainably while avoiding the common pitfalls that derail many AI transformations. The key is starting now, even with imperfect data, and refining your measurement approach as you learn what drives value in your specific context.